Chapter 9 Supervised Learning – Predict New Data
- Prediction-focused mindset that invites automation and competition.
- A good model has low generalization error - it predicts unseen data well.
- A machine learning mindset.
Everything Pete touched became a prediction problem. He could no longer play sports, only bet one the outcome. When he read books, he skipped to the end to check if his predictions were correct. Pete’s social life suffered as he was always trying to predict the next words in the conversations. His life began to improve only when he discovered supervised learning as an outlet for his obsessions.
It was 2012, and I had just developed a statistical model to predict whether a patient would develop type 2 diabetes. And now it was time to win some money with that model. I uploaded the file with the model predictions to the competition’s website, which was evaluating the results. Fingers crossed. But then the disappointment: the predictions of my model were terrible.
At the time, I was a master’s student in statistics. I modeled diabetes risk using a generalized additive model, a model often used in statistical modeling. More importantly, I created the model with frequentist modeling mindset. I thought a lot about the data-generating process, manually added and removed variables, and evaluated the model based on goodness of fit on the training data. But this approach completely failed me in this prediction competition. A confusion moment for me: statistical models can be used for prediction and statistical learning is even the foundation of machine learning. This overlap in theory and methods mislead me to believe that statistical modeling and supervised machine learning are the same thing. But the (archetypal) modeling mindsets are fundamentally different, especially regarding model evaluation. While I didn’t win any money in the competition (59th place out of 145), I did win something more valuable: a new modeling mindset called supervised learning.
9.1 Predict Everything
In supervised machine learning, everything is a prediction task, typically regression or classification.
With “prediction” I mean proposing values for some quantity for which a ground truth exists (at least for the training data).
Based on this definition, assigning data points to a cluster is not prediction, because there is no ground truth for the clusters.
Prediction can mean assigning a classification score, a numerical value (regression), a survival time, etc.
It’s amazing how many applications can be formulated as prediction tasks:
A
- Credit scores: the probability that someone will repay their loan.
- Predictive maintenance: many machines require regular inspection and repair. Time-to-failure can be predicted.
- Demand forecasting: using historical sales data to estimate demand for a product.
- Image classification: how should the image be classified? For example, image classification can be used to detect cancer on CT images.
As these examples show, supervised learning adopts the “task-oriented” trait of the machine learning mindset. Prediction is a task and can be used to do practical things. A modeling mindset that deals only with prediction tasks seems very narrow. But there is a surprisingly large number of applications for which prediction can be useful. And the type of data that can be used in predictive models can also be quite diverse: The input to the predictive model, usually called features, can be text, an image, a time series, a DNA sequence, a video, a good old Excel spreadsheet, …
9.2 Learning Is Loss Minimization
Turning any modeling task into a prediction problem is not the only defining trait of the supervised learning mindset. A core idea of supervised machine learning is risk minimization. And a good supervised model has a low generalization error, meaning that the prediction for new data points is close to the respective ground truth. To quantify how close a prediction is to the ground truth, the machine learner uses a loss function. The loss function takes the ground truth value and the predicted value as inputs and returns a number, that expresses how close these two are. The larger the number, the worse the prediction. The goal in supervised learning is now to find the function \(f\) that minimizes the loss across the data.
The focus here is on optimizing the loss without specific constraints what the function has to look like. In statistical modeling, the model would have to be motivated based on probability distributions, but in machine learning, any form is allowed. A great difference in mindset.(Breiman 2001) This makes supervised learning a machine learning mindset: Supervised learning is externally motivated by how the model predictions performs on new data. The model is trained using one part of the data (training data) and evaluated on another part (test data). What separates supervised learning from unsupervised and reinforcement learning: supervised learning requires a ground truth for every data point.
Let’s exaggerate a bit and imagine a very zealous supervised learner.
This person would outright reject to work on any problem that doesn’t come with a ground truth.
This zealot would reject to work on unsupervised problems.
The archetypal supervised learner wouldn’t even consider working on unsupervised learning.
There is no ground truth, so anything that the model outputs couldn’t be verified.
Any time the supervised learner has to model data, they will be hell-bent to find labels, even if it means hiring lots of people just to do the labeling.
9.3 Learning Is Searching
We danced around the question of what the prediction function, the model, really is. In statistical modeling it’s “simple”, because the function is derived from theoretical distributions. This simplifies the problem to finding the best parameterization of the statistical model. For the linear regression model, the modeler can even be sure that it’s the optimal parameterization, given the linear restriction. In supervised machine learning, the loss helps to evaluate any proposal of a prediction function, but it doesn’t say how to search for it. The loss function is like a scale: it can tell you your weight, but it can’t tell how to live your life.
All the possible prediction functions live in the hypothesis space. It’s a big space, holding infinitely many functions with different shapes, parameters and forms. Think of the hypothesis space as a dark forest. Supervised learning algorithms illuminate paths through the forest so that, within these paths, the best prediction function with the lowest loss can be found. And while the globally best function might not be within this path, the solution might be locally optimal. Supervised learning algorithms work by putting some constraints on the functions, which makes the hypothesis space manageable to search. That’s where all these different model classes come into play: decision trees, support vector machines, linear regression models, random forests, boosting, neural networks, … (Hastie et al. 2009) Each comes with different algorithms that more or less efficiently searches for good solutions by making the hypothesis space manageable.
For simplicity, let’s say we have only one feature and a prediction target.
- By restricting the prediction function to be linear, the algorithm only has to search for the best multiplier of the features (the coefficient), which greatly simplifies the search.
- Decision tree algorithms produce prediction functions that look like step functions. The search is simplified to finding the best feature values where to make the cut.
- Neural network are universal function approximators that can, in theory, approximate any function continuous prediction function.(Hornik et al. 1989) For neural networks, the search is simplified to finding a good weight configuration.
Each machine learning algorithm has its own procedure to search the hypothesis space.
But this search comes with one major problem: overfitting. Remember, the goal is to achieve a low generalization error. As long as the model relies only on training data, it’s unclear how well the model will predict new, unseen, data points. Worse, machine learning models can easily overfit the training data. Think of overfitting as memorization of the training data. When the model perfectly memorizes the training data, it will have have zero loss on the training data, but will likely perform badly with new data.
The opposite of overfitting is underfitting. If the hypothesis space is too constrained, then model may not be flexible enough to represent the true relationship between the input features and the target.
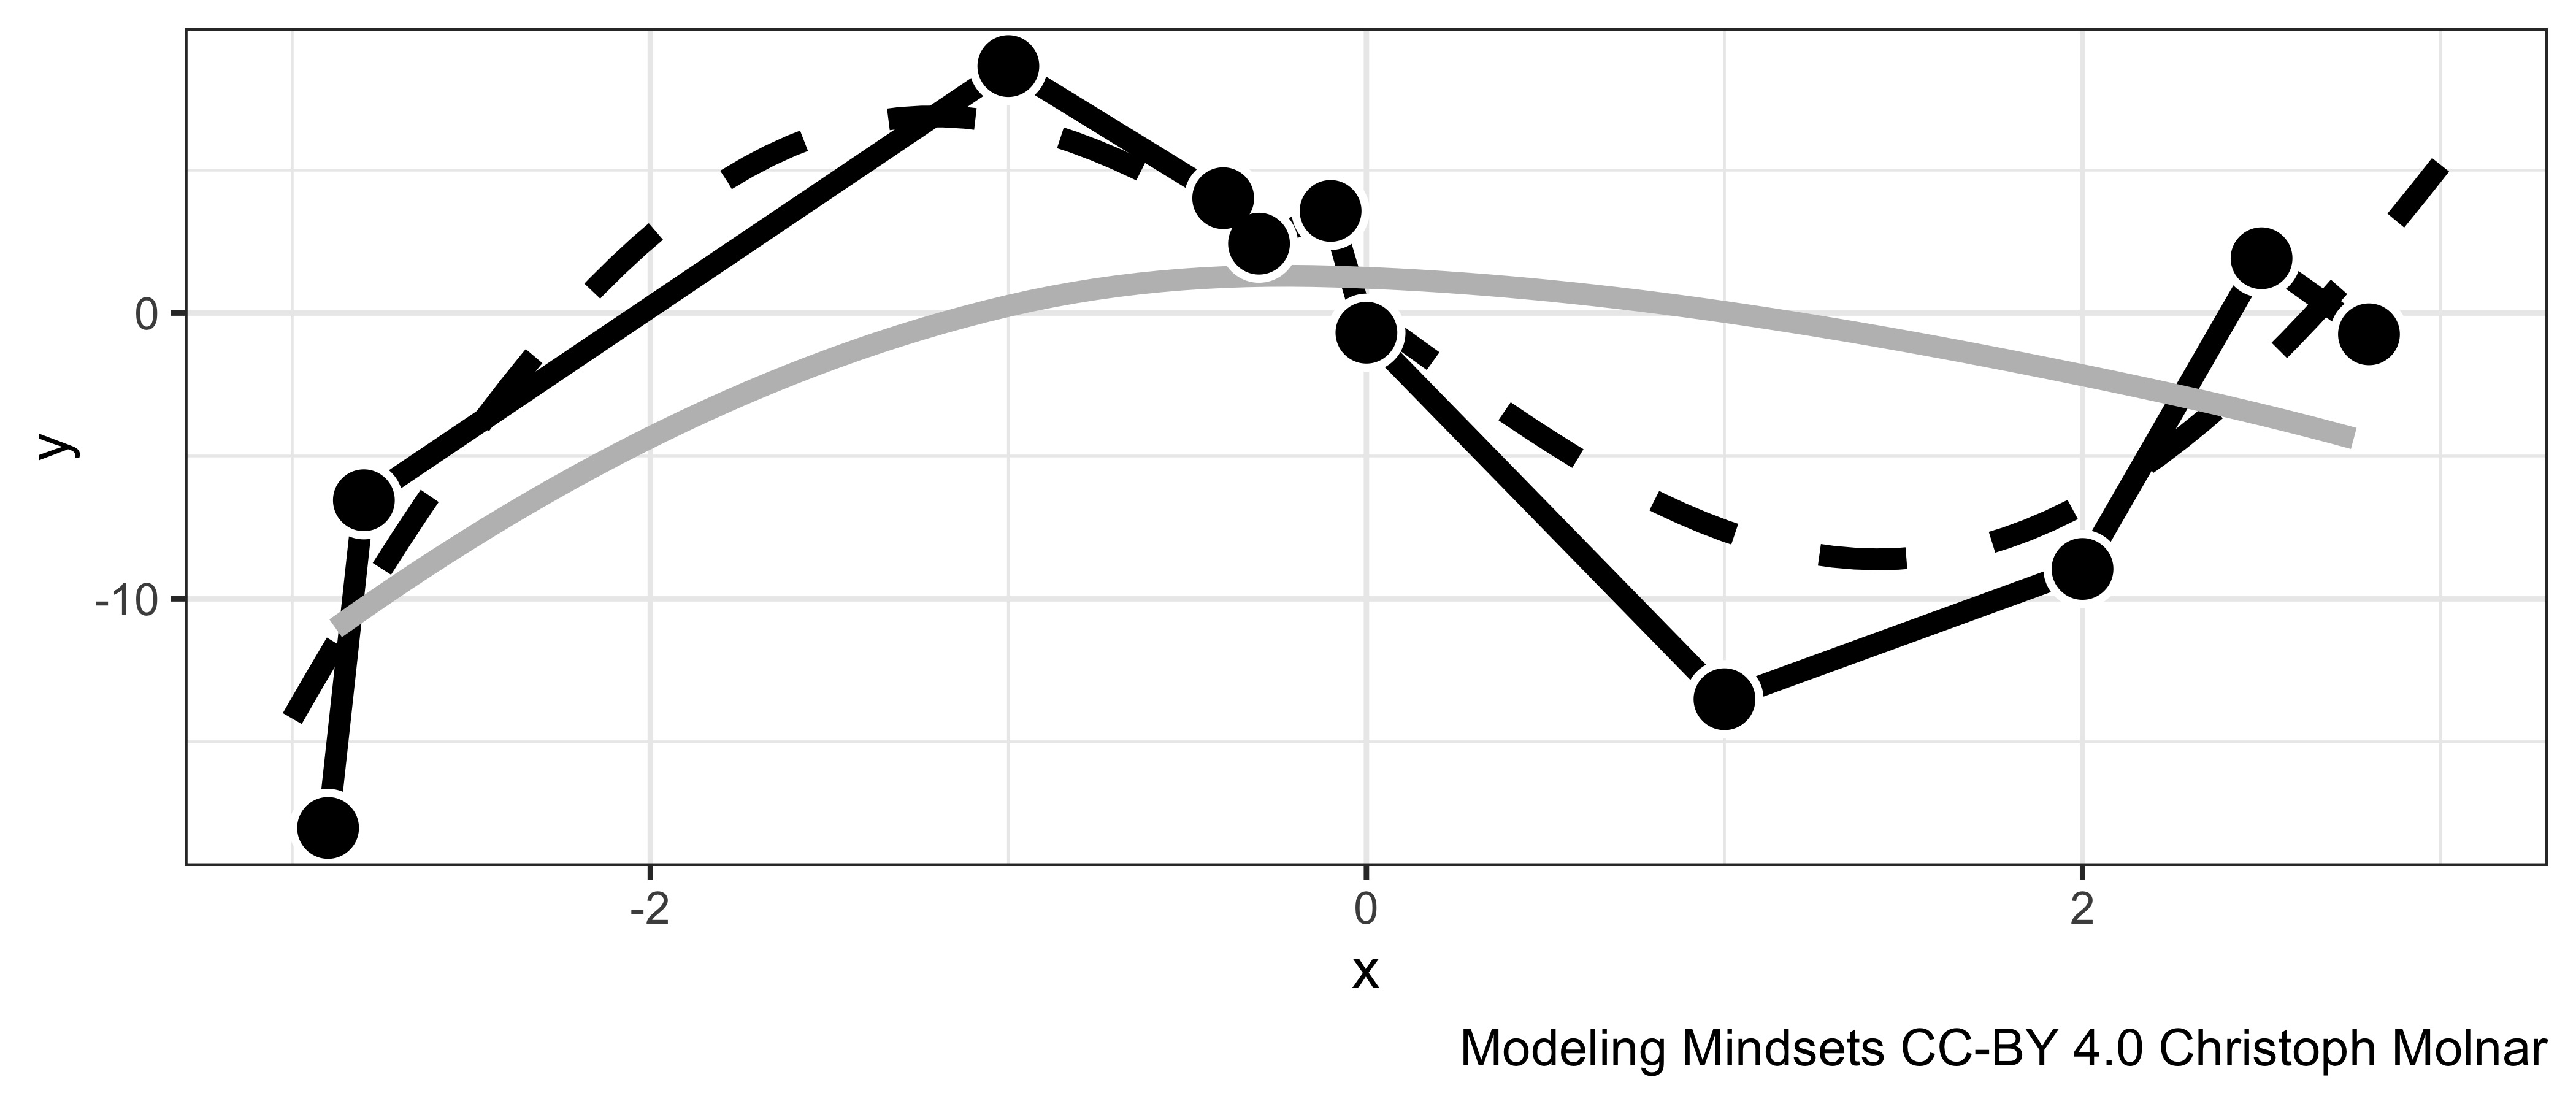
FIGURE 9.1: The target y is dependent on x through a function f(x) (dotted line). The observed data (points) have an additional random error. One model overfits the randomness in the training data (black line), and the other underfits (grey line).
Fitting a supervised model means walking a fine line between underfitting and overfitting. Model evaluation is central to finding this delicate balance and not ending up on one side of the cliff or the other. The key element to finding that balance is regularization and hyperparameter tuning. Most training algorithms have hyperparameters that affect how the model looks like in the end. Many of these parameters serve as “tuning knobs” and can regulate how complex the model is allowed to get. For decision trees, one such hyperparameter is the depth of the tree: the deeper the tree, the more complex relationships and interactions in the data it can model. Finding the right tree depth balances the tree between underfitting (tree to short) and overfitting (tree to deep). Statistical models also have to deal with the problem of underfitting versus overfitting. But they deal with it differently: By putting strong restrictions on the model functions, the models tend to rather underfit than overfit. And many evaluation measures, such as R-squared, have versions that account for the complexity of the model.
9.4 Evaluation
Let’s say you want to enter a cooking competition. A contest with a panel of judges who will evaluate your food and insult you on live TV if it tastes like crap. The jury is the ultimate test of your cooking skills. You have never cooked for these judges before, so this is also a test about how well your cooking skills generalize to new data points. But are your confident enough about your skills?
What if your supposed kitchen prowess are overfitting the strange test of your family? Let’s assume they might love salt more than the average. The jurors would be like: “Did you cook this with seawater?”, “What is this? Bread? Or a salt lick for goats?”. In order to avoid bringing shame to your family and name, you decide to validate your skills before this ultimate test. So you cook for some new people who have never tried your dishes before. This way you can evaluate your skills without having to waste your shot in the contest.
Rigorous evaluation is essential in supervised learning. A model generalizes well to the real world if the generalization error is low. A typical recommendation of supervised machine learners is to set up the evaluation pipeline even before training the first model. In supervised machine learning, evaluation means measuring a loss for unseen data, usually called “test data”. The test data are like the judges in a cooking competition. The machine learner may not to use the test data to train the model or test it prematurely. The test data may only be used for the final evaluation. If the test data influence the model training or choice in any way, it’s “burned” and does not show the true performance of the model. Rather the evaluation will be too optimistic.
Because of this “burning” of the test data, machine learners need different strategy to guide their model building. The test data are set aside. Whether to compare models or to try different configurations of a model, the machine learner needs unseen data. The trick is to repeat this train/test split within the training data. So the modelers cut off a portion of the training data that can be used to evaluate modeling decisions. This data set is usually referred to as validation data.
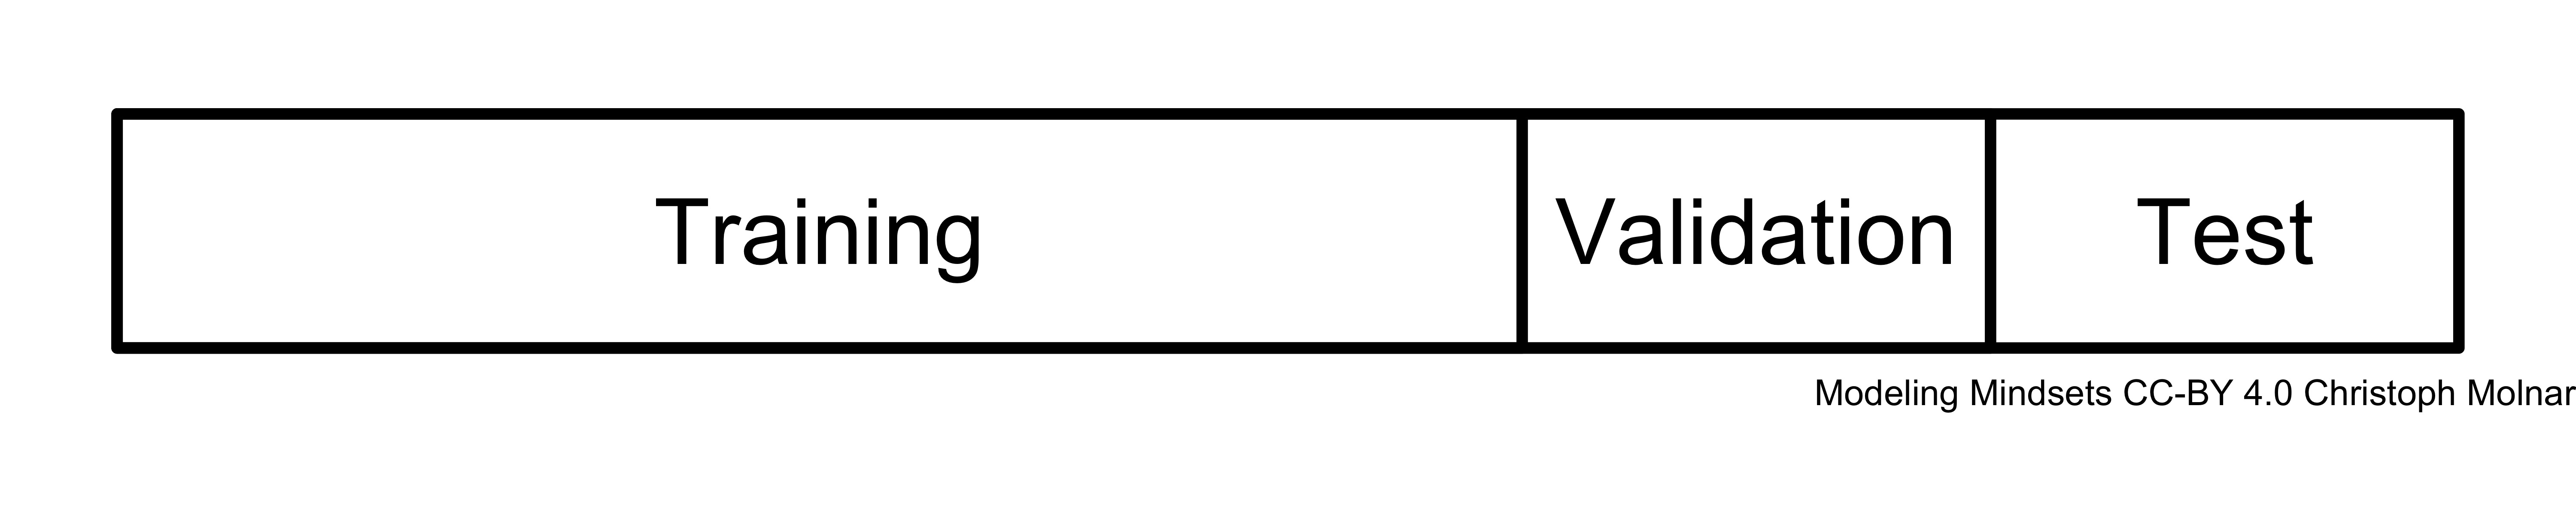
FIGURE 9.2: For evaluation, the data is usually split into training, validation and test data. There are more complex splitting schemes where the data is split multiple times.
In the simplest version, the data is split once before model training into training, validation and test data. In reality, techniques such as cross-validation are used to split the data multiple times and reuse the data intelligently.
9.5 An Automatable And Competitive Mindset
Supervised machine learning is automatable to a degree that surpasses all other mindsets. Using a well-defined evaluation procedure, the generalization error, the entire process of model building can be automated. Supervised machine learning is essentially an optimization algorithm with a clear goal. Compare that to statistical modeling, such as Bayesian and frequentist inference, where the modelers have to make many assumptions, choose the right distributions, decide on the variables to use in the model, look at diagnostic plots, …
There is an entire subfield of machine learning, AutoML, that deals with automating the training pipeline. The pipeline can include feature engineering, model training, hyperparameter optimization, evaluation, etc. Automating the supervised machine learning pipeline is computationally intensive, so there is a lot of research on how to automate everything in a smart way. As a result of this automation capability, there is an entire industry with hundreds of web services and products that automate the training process for you.
Automation can also be problematic. It creates distance between the modelers and the underlying modeling task. Automation makes modelers less aware of the shortcomings of the data. On paper, the model may look very good, because the generalization error is small. Under the surface, the model may be garbage because it uses features that are not available at the time of the prediction, or the data are terribly biased, or missing data were not handled correctly to, name just a few possible errors.
The objective evaluation turns supervised learning into a competition of models. It also invites competition between people. Entire websites are dedicated to hosting machine learning competitions where the best modelers can win money. Your skills as a modeler are reduced to your ability to optimize for a single metric. A ranking that ignores domain expertise, model interpretability, coding skills, runtime, … The idea of competition has also taken hold of machine learning research itself: scientific progress in machine learning, in some parts, has become a competition of benchmarks. It defines progress in machine learning research as one approach beating another in some form of competition.
9.6 Nature, Statistics and Supervised Learning
As we have seen, the mindsets of statistical modeling and supervised learning can be quite different. At their core, the two mindsets involve different ideas of how to model aspects of the world. The following comparison is more or less a summary of Leo Breiman’s famous article “Statistical Modeling: The Two Cultures”.(Breiman 2001)
In the context of prediction, nature can be seen as a mechanism that takes features \(X\) and produces output \(Y\). This mechanism is unknown and modelers “fill” the gap with models.

FIGURE 9.3: Nature
Statisticians fill this box with a statistical model. The statistical model is supposed to represent nature. If we are somewhat convinced that we have found the mechanism, we can then take the model parameters and interpret them as if it was the true mechanism in nature. Nature’s true mechanism is unknown and not fully specified by the data, we have to make some assumptions about the forms of this mechanism, which we represent with the function \(f\).

FIGURE 9.4: Statistical Model
In supervised learning, nature is seen as unknowable, or at least no attempt is made to reverse-engineer the inner mechanisms of nature. Instead of the intrinsic approach, supervised learning takes an extrinsic approach. The supervised model is supposed to mimic nature. It should show the same behaviour as nature, but it doesn’t matter if it achieves this behaviour in the same way.
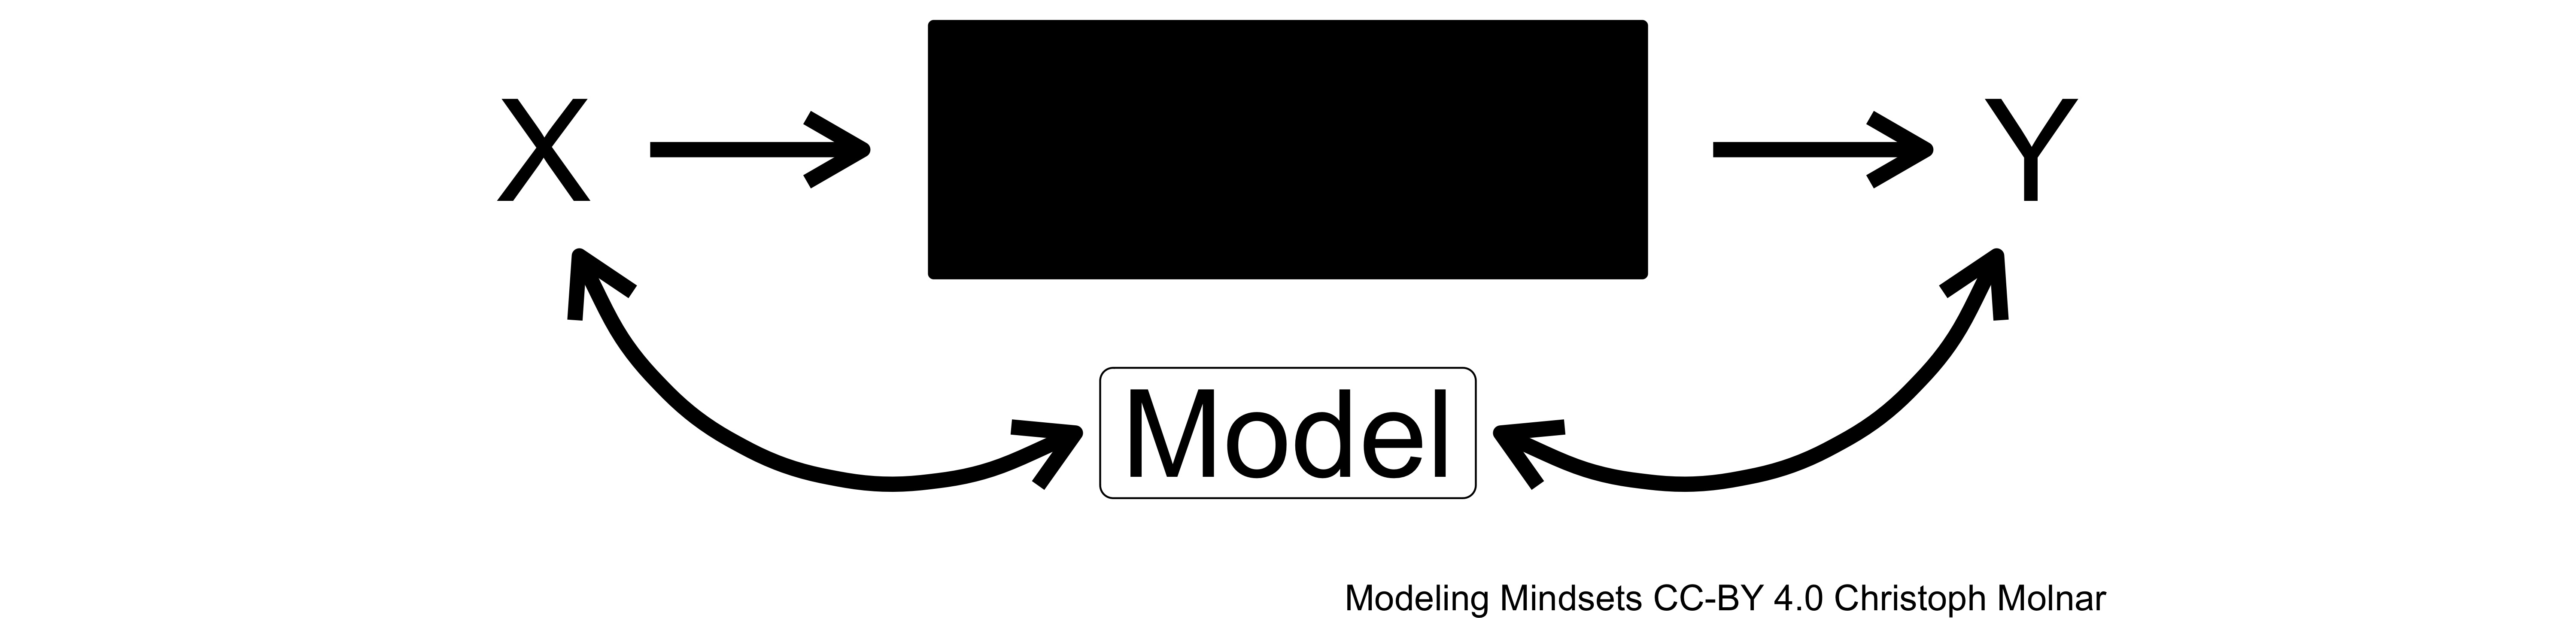
FIGURE 9.5: Supervised Learning Model
Again, a cooking analogy: Suppose you want to recreate a dish that you ate in a restaurant. A statistician cook would try to find a plausible recipe, even if the end result is not perfect. The supervised machine learner cook would only be interested in the end result; it doesn’t matter whether it’s was exactly the same recipe.
No one mindset is inherently better or more useful than another. They are different mindsets with different strengths and limitations. If a task involves evaluating unseen data against a well-defined performance metric, the best approach to that task is probably supervised learning. If your task requires a model with a strong theory that can explain the relationships in the data, statistical modeling is the way to go.
9.7 Strengths
- The most straightforward mindset when it comes to making predictions.
- The choice of loss function allows the model to be adapted quite well to the task at hand.
- Supervised machine learning is highly automatable.
- Supervised learning has a very coherent evaluation approach that I personally find very convincing, though a bit narrow.
9.8 Limitations
- Supervised learning often produces models that are not interpretable. But approaches to make them interpretable exist.(Molnar 2022)
- Supervised learning is not as hypothesis-driven as statistical modeling.
- Making decisions based on only the most likely outcome ignores tail risks from less likely, but possible extreme outcomes.
- Uncertainty quantification is not prioritized in supervised learning, as it is in, for example, Bayesian inference.
- Automation can lead to overlooking issues with data, model and task formulation.
- Generalization error is a good way to quantify generalization, however relying solely on this metric can fail in dumb ways. There are many examples, such as using asthma as a predictor of lower risk of pneumonia(Caruana et al. 2015), classifying based on watermarks (Lapuschkin et al. 2019), and misclassifying dogs as wolfs based on snow in the background (Ribeiro et al. 2016).
- Machine learning was supposed to free humanity from menial labor. And yet, here we are labeling data for the computer, because supervised learning is data-hungry and so often requires labels made by humans.