Chapter 10 Unsupervised Learning – Find Hidden Patterns
- Uncover hidden patterns in data
- Typical tasks: Clustering, anomaly detection, dimensionality reduction, and association rule learning
- A more open and diverse mindset
- One of the three machine learning mindsets along with supervised learning and reinforcement learning.
*A group of supervised learners and one unsupervised learner decide to climb a mountain. The trip turns into a race: Who will be the first back to the hut? The unsupervised learner quickly falls behind. After an exhausting day, they return to their hut one by one. To their surprise, the unsupervised learner is already in the hut. Everyone wanted to know how the unsupervised learner managed to be so fast. “When you all sprinted off, I took a detour,” the unsupervised learner reported,“You won’t believe this, but I found a rare type of mushroom. I also divided the area around the hut according to the vegetation. But the best part is that …” “Wait!” interrupts one of the supervised learners, “How come you did all those things AND were able to climb the mountain faster?”
“Mountain? What mountain?”*
Tip Top Travel, a travel agency I just made up, offers a wide range of trips, from all-inclusive holidays in Spain to hiking in Norway and weekend city trips to Paris. They have a huge database on the booking history of their customers. And yet, they know surprisingly little about the general patterns in their data: Are there certain type of customers? For example, do customers who travel to Norway also like Sweden? Our imaginary travel company’s big data is a dream for unsupervised learners. They might start with a cluster analysis to identify groups of customers with similar travel behaviors. For example, with the k-means algorithm.
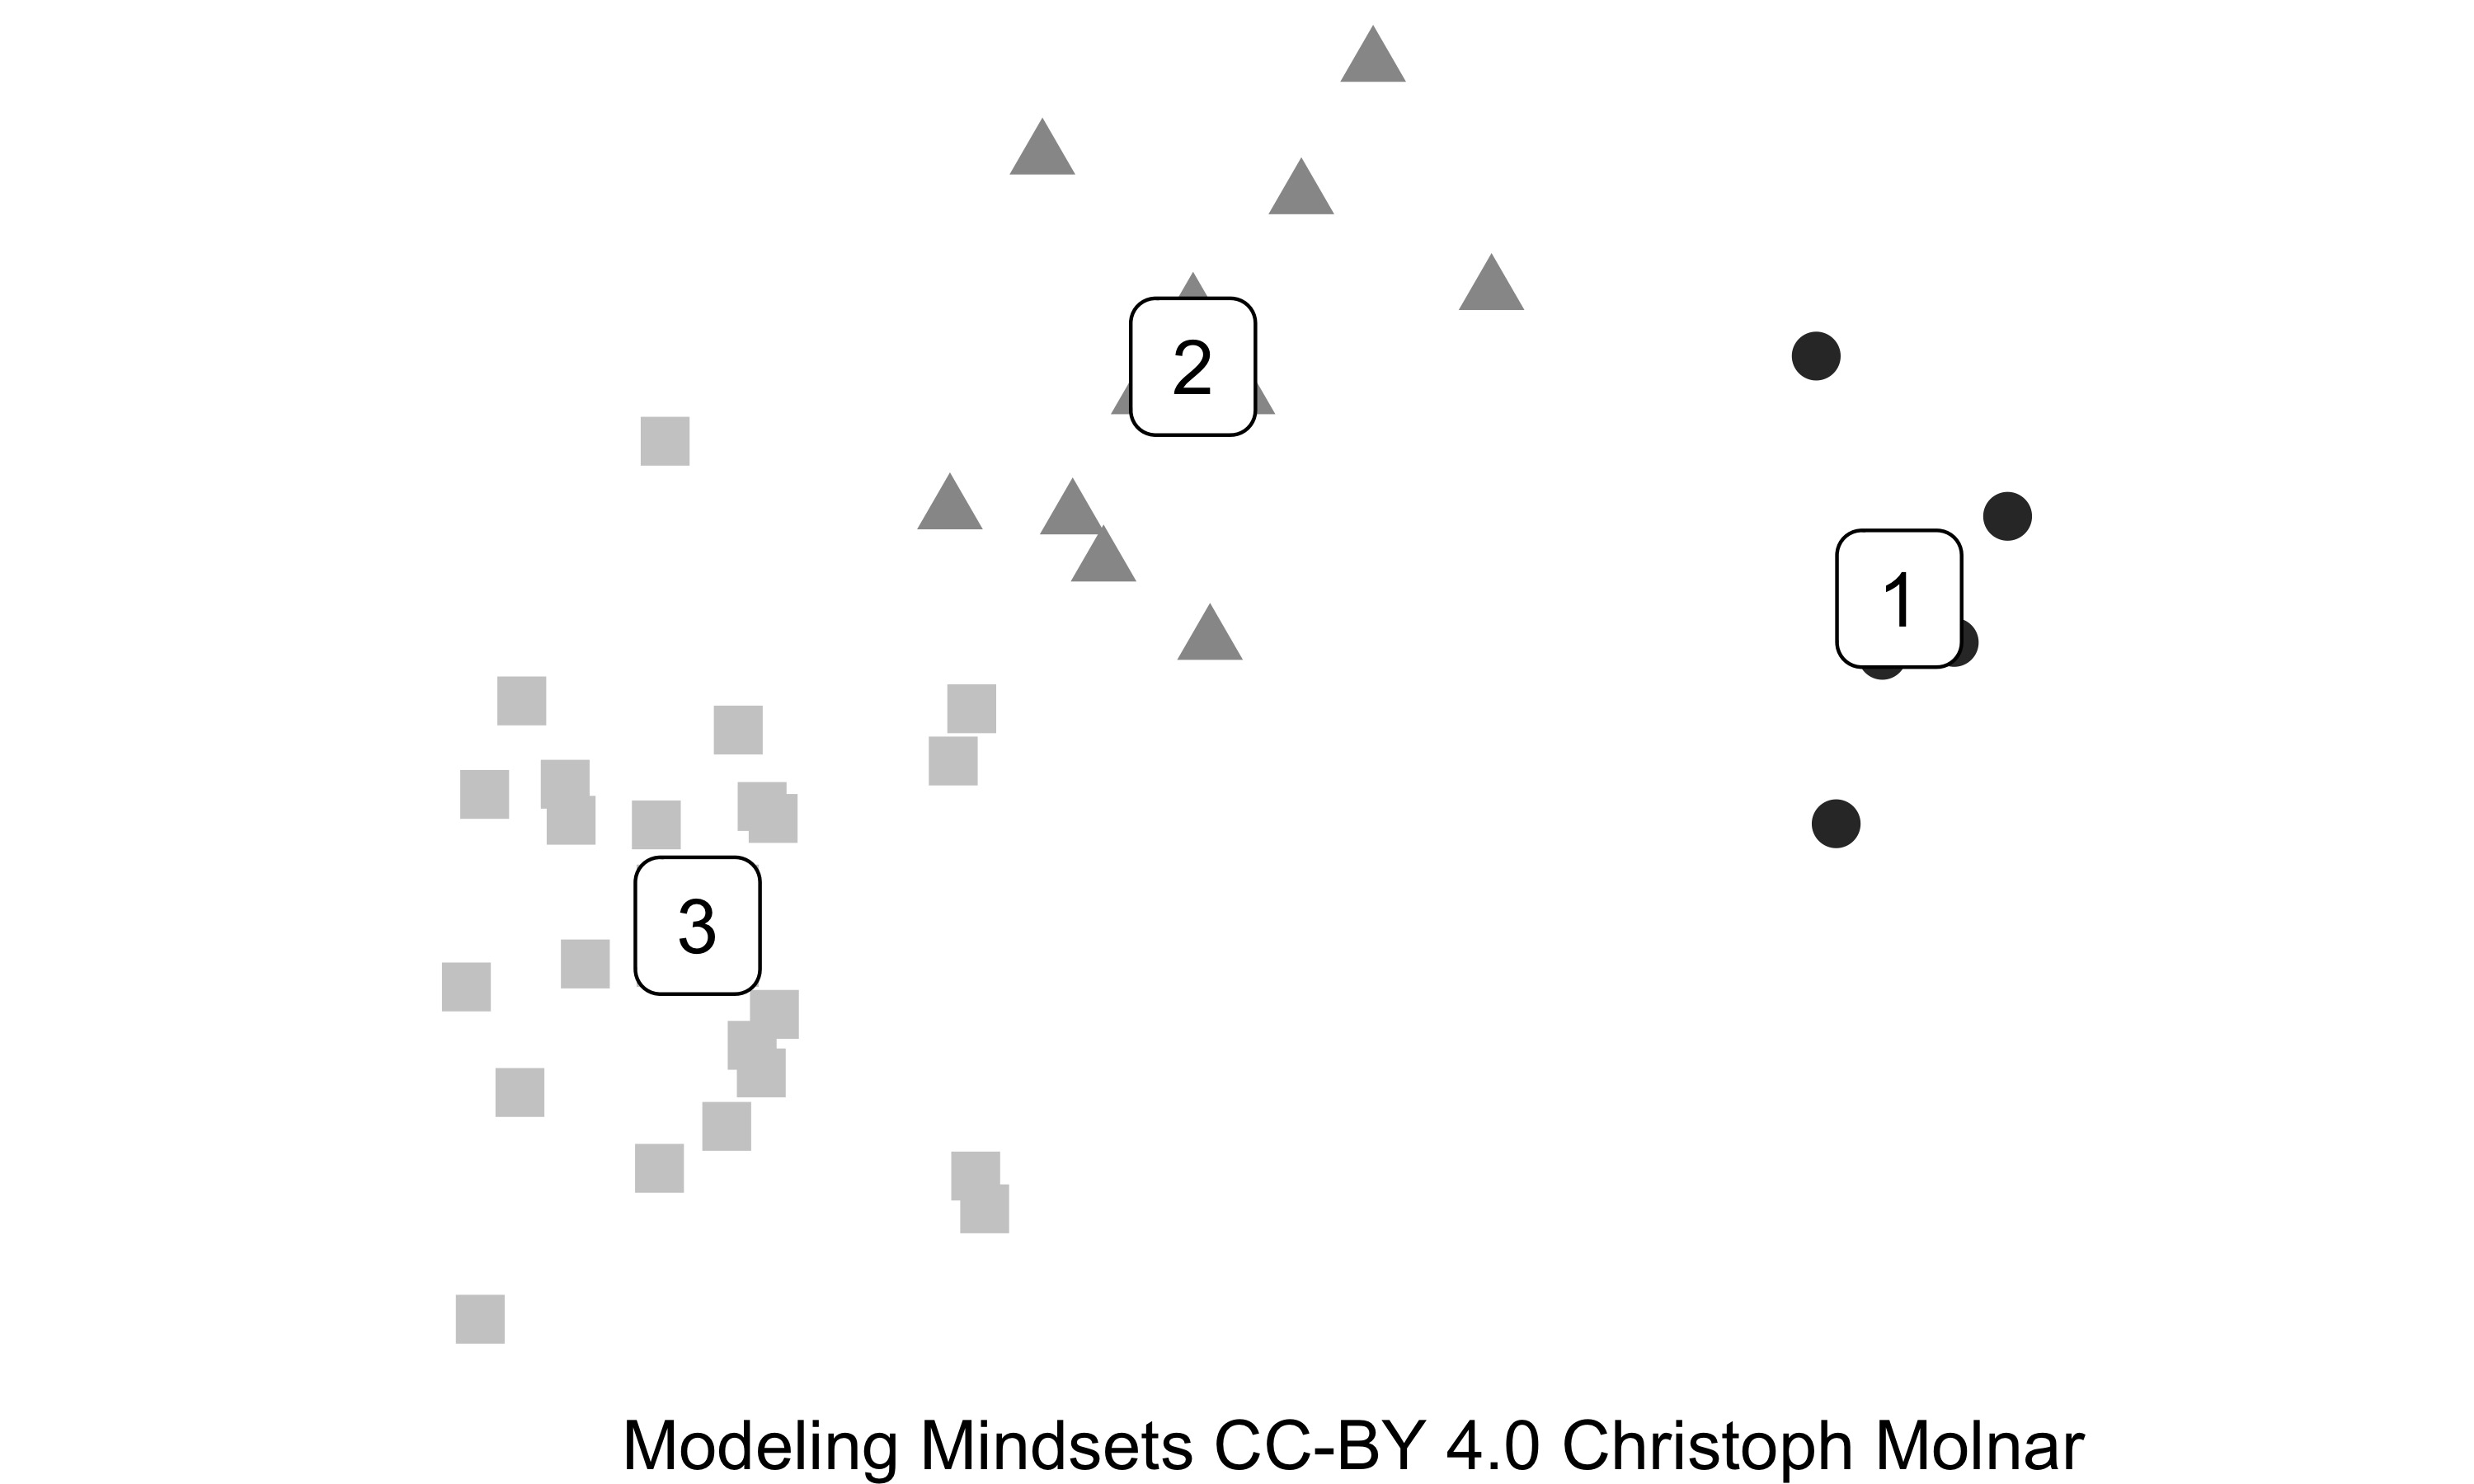
FIGURE 10.1: Three clusters for two features (x-axis and y-axis) based on k-means clustering.
The k-means algorithm divides the customers into clusters. Starting with random cluster centers,the algorithm iteratively optimizes the centers so that customers in a cluster are close to each other. The objective of k-means is to minimize the distances between centers and assigned data points, averaged over all customers. Together with domain experts, they can try to name the clusters according to the distributions of the features: One cluster could be “families looking for relaxation” (on average, books twice a year for 1.9 adults and 2.1 children), another could be “luxury explorer” (on average books once a year and very expensive trips).
10.2 From Clustering to Dimensionality Reduction
To get a better understanding of unsupervised learning, let’s take a look at typical tasks.
10.2.1 Clustering and Outlier Detection
Clustering and outlier detection are two sides of a coin: Both ask where the mass of the data lies.
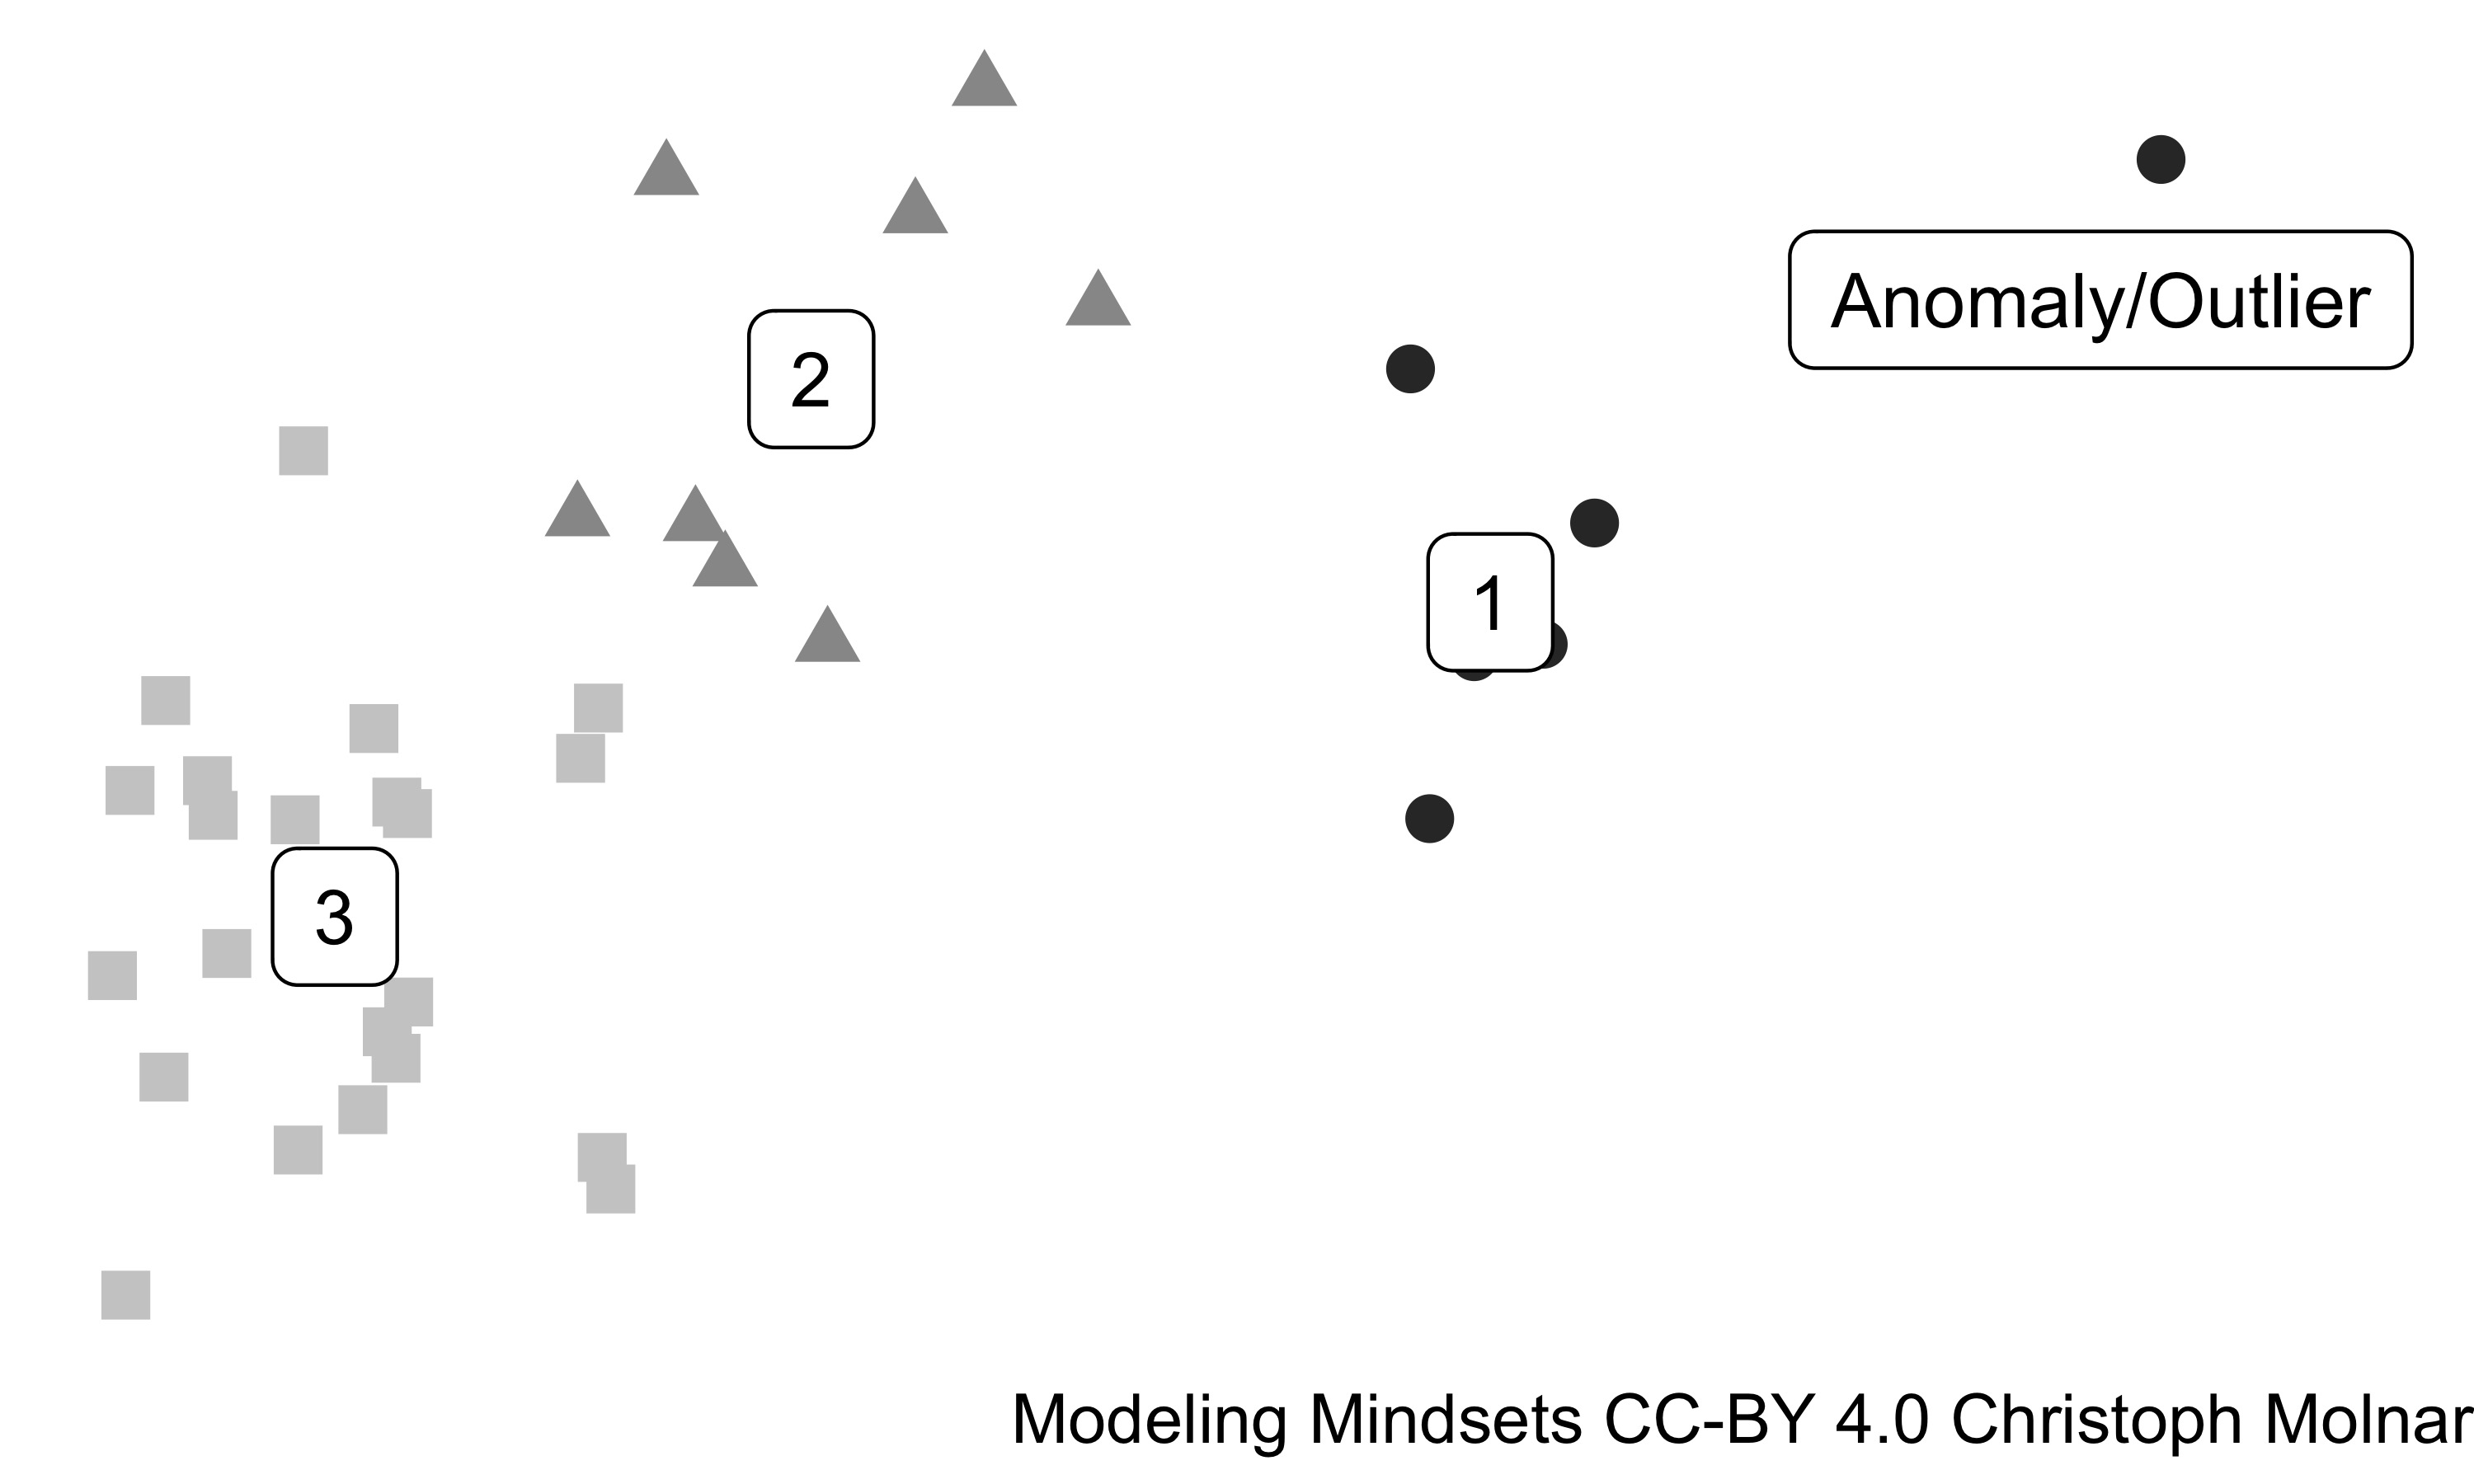
FIGURE 10.2: 3 clusters and 1 outlier in a 2D feature space.
Clusters are regions in the feature space with a high concentration of data points. In terms of probability, these regions are modes of the data distribution. Outliers are data points in regions with otherwise data. Clusters are usually defined such that all the data points within a cluster a similar in their feature values. There are many different approaches for finding clusters: hierarchical clustering, k-means, k-medoids, DB-SCAN, PRIM, Gaussian mixture models, self-organizing maps, … These clustering methods have different motivations, ranging from statistical to more algorithmic, again showing that unsupervised learning is externally motivated. It isn’t particularly important how clusters are detected. Different clustering methods may find very different clusters. Let’s take a look at a another solution for cluster analysis from Figure 10.1.
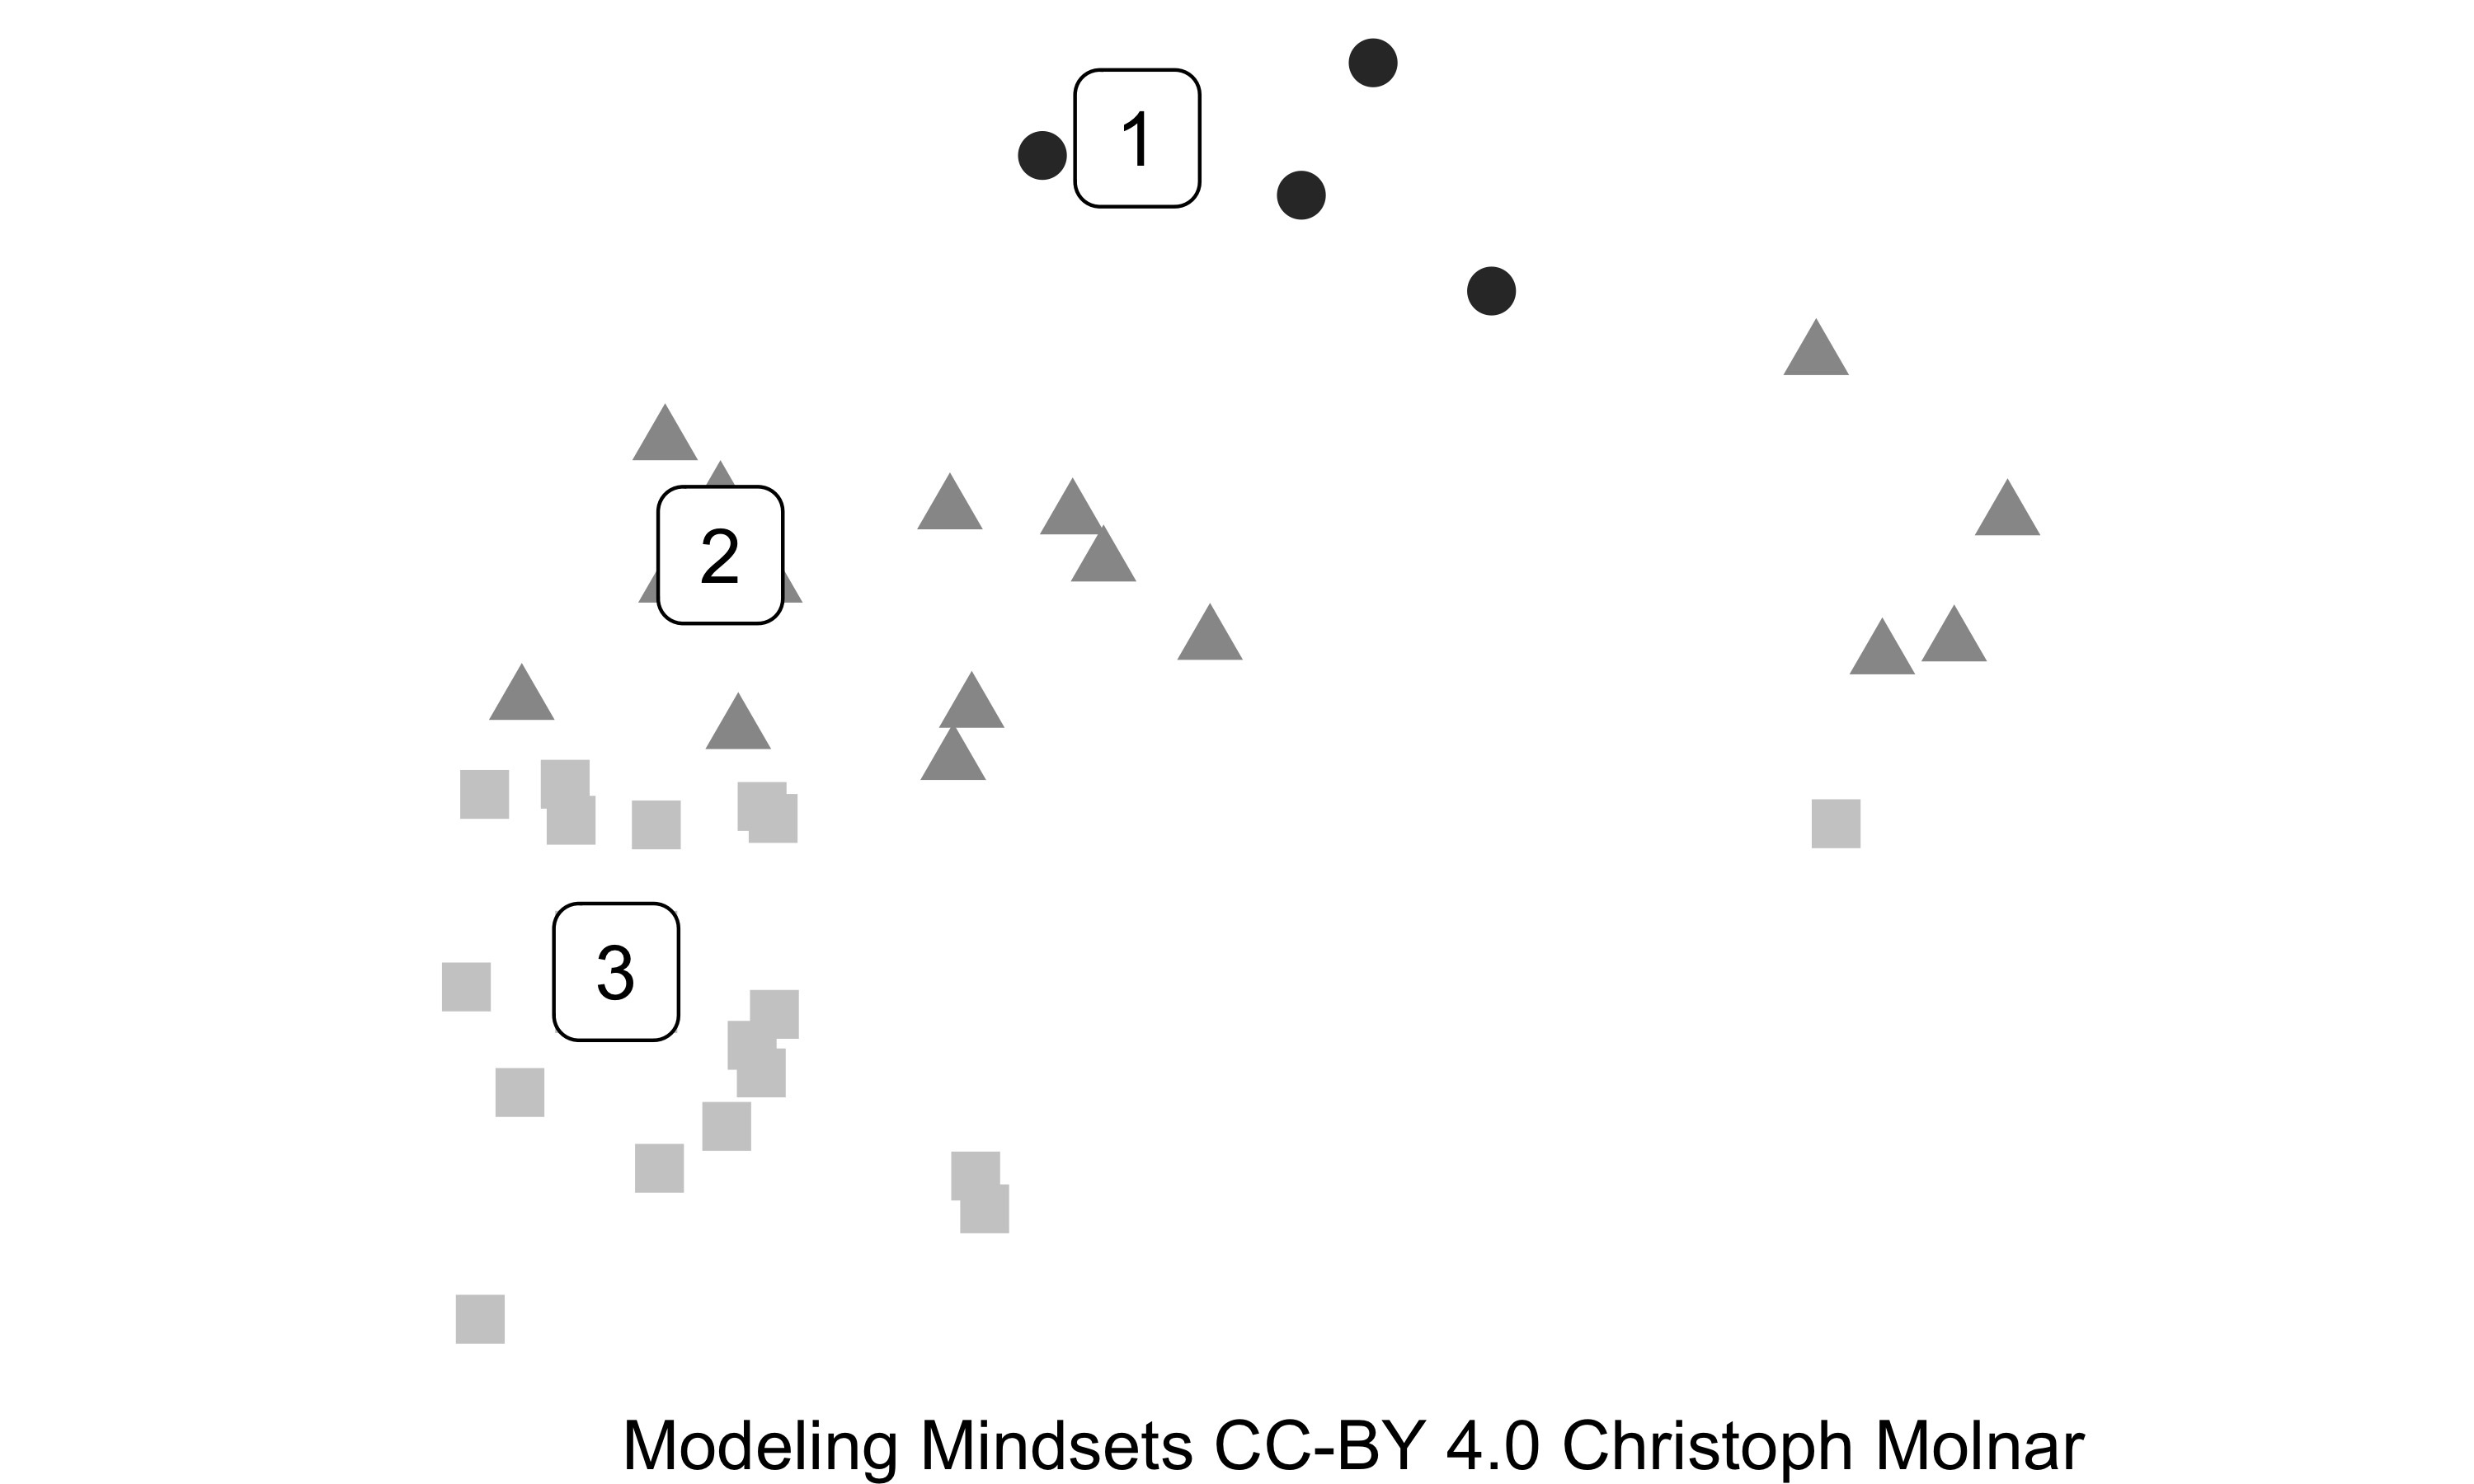
FIGURE 10.3: Poor clustering solution in terms of Euclidean distance. But a good solution when only the horizontal direction is considered.
The clusters in Figure 10.3 are clearly a poor solution based on Euclidean distance – assuming that both features matter equally. But perhaps the feature that spreads the data in the horizontal direction is irrelevant and should be ignored for clustering. Domain experts can tell you which features are important and which aren’t. Per default, all features are usually weighted equally, which is not necessarily the best option. Features might be correlated: When clustering fruits, two features might be “volume” and “volume after peeling”, which almost have the same information. Using both features for clustering means giving twice as much weight to the volume compared to other features. And it gets worse. What if features are measured at different scales, such as a weight, a length, and a sum of money? How can a modeler combine these features into a single distance measure, especially when the features even have different cardinalities, like numerical and categorical features?
“Excuse me, how do I get from point A to point B?” “You go down this street and turn right after 10 meters. Then you go another $7 and turn left until red becomes blue!”. Unsupervised machine learner have to live with ambiguity. Going to bed every night, questioning the fabric of space and time. Supervised machine learners don’t have this problem, at least not to this extent. The weighting of features is “supervised” by the relationship between the features and the target for the ground truth is known.
Cybersecurity specialists monitor events in the intranet (among other tasks). Their job is to protect the company from cyber threats: Trade secret theft, malware, digital blackmail, you name it. But there are thousands of employees who leave their daily digital footprint. The specialist uses rules to detect some attacks: If someone tries to brute force a password to log into a service, that’s a red flag. But what about behaviors that don’t follow such simple patterns and what about new type of attacks? Fortunately for the cybersecurity specialist, there is unsupervised learning. Outlier detection, an unsupervised learning task, is concerned with finding extreme data points. Typical applications include financial fraud detection and cybersecurity. Isolation forests, a popular outlier detection tool, works by isolating extreme data points. Other algorithms are motivated by probability distributions and flag data points that seem unlikely. Isolation forests, statistical tests, one-class support vector machines and hidden Markov models – the variety of methods and underlying motivations shows again that (unsupervised) machine learning is a pragmatic modeling mindset.
10.2.2 Association Rule Learning
I love grocery shopping. Many people hate it, but only because they are unaware of it’s magnificence: Supermarkets are incredible places that let you live like royals: exotic fruits, spices from all over the world, products that take months or even years to make, like soy sauce, wine and cheese. But I digress. Let’s talk about association rule learning, which is usually introduced with shopping baskets as example. When you go shopping, you can think of your shopping basket as a binary dataset. Either you buy a certain item (1) or you don’t buy it (0). Other people also go shopping and generate their own data of 0’s and 1’s.
The baskets might look like this: \(\{yeast, flour, salt\}\), \(\{beer, chips\}\), \(\{sandwich, chips\}\), \(\{cheese, onions, tomatoes, potatoes, flour, olive oil, chocolate, beer, chips\}\). The goal of association rule learning is to identify patterns: Do people who buy flour often buy yeast? Association rule mining is again a case of describing the data distribution. An association rule might be \(\{beer\} \Rightarrow \{chips\}\) and would mean that people who buy beer frequently buy chips. In more formal terms, association rules are short descriptions that use conjunctive rules to describe high density regions in a binary feature space. A well-known algorithm is the Apriori algorithm, but again, there are many option to choose from.
10.2.3 Dimensionality Reduction
Having many features can be a curse. The curse is that data density decreases exponentially with each additional features. That’s a problem regardless of the modeling mindset. Dimensionality reduction can be used to break this curse, or at least reduce its burden. Not all features contribute towards \(P(X)\): Some features may almost have no variance, others may be highly correlated with other features. A subset of the features may be enough to represent the data distribution. One way to reduce dimensionality is by removing features based on information-theoretic measures such as statistical correlation. Another solution is to map the data into a lower-dimensional space. This type of dimensionality reduction usually involves a matrix multiplication of the original feature matrix: principal component analysis (PCA), ICA, non-negative matrix factorization, multidimensional scaling, t-SNE, and so on. If each data point represents a fruit, features like height, width and weight might be mapped to a new feature / dimension that represents the volume of the fruit.
Unsupervised learning includes more tasks than just clustering, outlier detection, association rule learning and dimensionality reduction. For example, archetypal analysis, latent variables, factor analysis, and more. Unsupervised learning is truly the colorful bird among the modeling mindsets.
10.3 Strengths
- Finds hidden pattern in the data that modelers using a supervised learning would likely miss.
- The overall mindset is open in terms of tasks, evaluation, and new discoveries.
- The world is messy. One often has data, and a sense that it might useful. In this case unsupervised learning is wonderful as it allows to just dive into the data without too many assumptions.
- As a more exploratory mindset, unsupervised learning is a good starting point for further analysis of the data, with a different mindset.
- Unsupervised learning works without a ground truth. This means no effort is required to label data.
10.4 Limitations
- A major limitation is the lack of a ground truth, which comes with the difficulty of evaluating the resulting models. As a result, there are many methods with often different results.(Hastie et al. 2009)
- Lack of ground truth also means that their is little guidance of how to weight the different features for finding clusters, reducing dimensionality and so on.
- Unsupervised machine learning is a good approach to the curse of dimensionality, but even so, unsupervised learning can suffer greatly from the curse. The more features the more difficult the interpretation of clusters become, for example.
- There is no guarantee that meaningful patterns will be uncovered.
- Doesn’t work well for prediction and inference.